Consider the following AdventureWorks query that returns history table transaction IDs for product ID 421:
SELECT TH.TransactionID
FROM Production.TransactionHistory AS TH
WHERE TH.ProductID = 421;
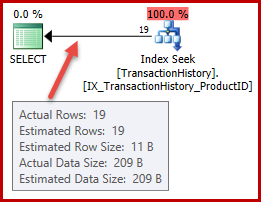
The query optimizer quickly finds an efficient execution plan with a cardinality (row count) estimate that is exactly correct, as shown in SQL Sentry Plan Explorer:
Now say we want to find history transaction IDs for the AdventureWorks product named "Metal Plate 2". There are many ways to express this query in T-SQL. One natural formulation is:
SELECT TH.TransactionID
FROM Production.TransactionHistory AS TH
WHERE TH.ProductID =
(
    SELECT P.ProductID
    FROM Production.Product AS P
    WHERE P.Name = N'Metal Plate 2'
);
The execution plan is as follows:
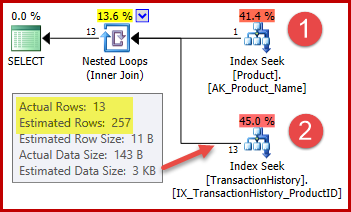
The strategy is:
- Look up the product ID in the Product table from the name given
- Locate rows for that product ID in the History table
The estimated number of rows for step 1 is exactly right because the index used is declared as unique and keyed on the product name alone. The equality test on "Metal Plate 2" is therefore guaranteed to return exactly one row (or zero rows if we specify a product name that does not exist).
The highlighted 257-row estimate for step two is less accurate: only 13 rows are actually encountered. This discrepancy arises because the optimizer does not know which particular product ID is associated with the product named "Metal Plate 2". It treats the value as unknown, generating a cardinality estimate using average density information. The calculation uses elements from the statistics object shown below:
DBCC SHOW_STATISTICS
(
    'Production.TransactionHistory',
    'IX_TransactionHistory_ProductID'
)
WITH STAT_HEADER, DENSITY_VECTOR;

The statistics show the table contains 113443 rows with 441 unique product IDs (1 / 0.002267574 = 441). Assuming the distribution of rows across product IDs is uniform, cardinality estimation expects a product ID to match (113443 / 441) = 257.24 rows on average. As it turns out, the distribution is not particularly uniform; there are only 13 rows for the "Metal Plate 2" product.
An Aside
You might be thinking that the 257-row estimate should be more accurate. For example, given that product IDs and names are both constrained to be unique, SQL Server could automatically maintain information about this one-to-one relationship. It would then know that "Metal Plate 2" is associated with product ID 479, and use that insight to generate a more accurate estimate using the ProductID histogram:
DBCC SHOW_STATISTICS
(
    'Production.TransactionHistory',
    'IX_TransactionHistory_ProductID'
)
WITH HISTOGRAM;
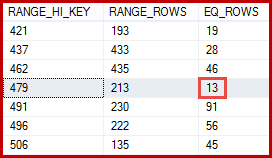
An estimate of 13 rows derived this way would have been exactly correct. Nevertheless, the estimate of 257 rows was not an unreasonable one, given the statistical information available and the normal simplifying assumptions (like uniform distribution) applied by cardinality estimation today. Exact estimates are always nice, but "reasonable" estimates are perfectly acceptable too.
Combining the two queries
Say we now want to see all transaction history IDs where the product ID is 421 OR the name of the product is "Metal Plate 2". A natural way to combine the two previous queries is:
SELECT TH.TransactionID
FROM Production.TransactionHistory AS TH
WHERE TH.ProductID = 421
OR TH.ProductID =
(
    SELECT P.ProductID
    FROM Production.Product AS P
    WHERE P.Name = N'Metal Plate 2'
);
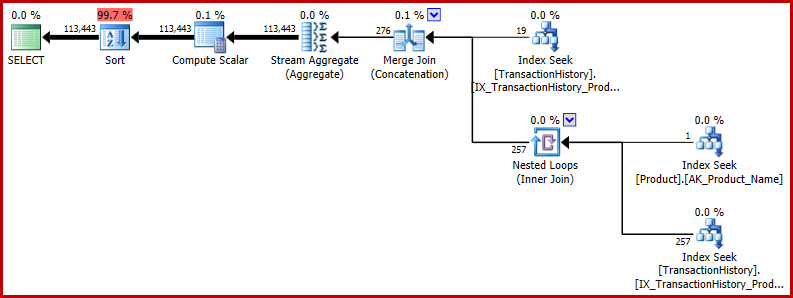
The execution plan is a little more complex now, but it still contains recognizable elements of the single-predicate plans:
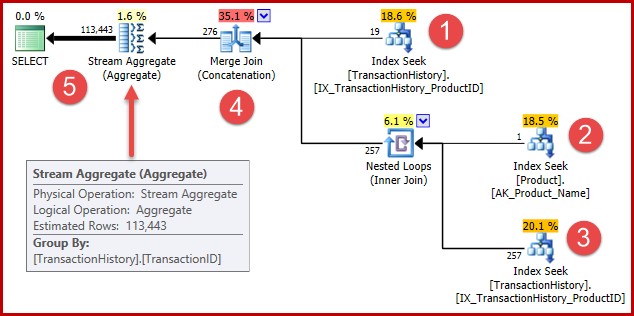
The strategy is:
- Find history records for product 421
- Look up the product id for the product named "Metal Plate 2"
- Find history records for the product id found in step 2
- Combine rows from steps 1 & 3
- Remove any duplicates (because product 421 might also be the one named "Metal Plate 2")
Steps 1 to 3 are exactly the same as before. The same estimates are produced for the same reasons. Step 4 is new, but very simple: it concatenates an expected 19 rows with an expected 257 rows, to give an estimate of 276 rows.
Step 5 is the interesting one. The duplicate-removing Stream Aggregate has an estimated input of 276 rows and an estimated output of 113443 rows*. An aggregate that outputs more rows than it receives seems impossible, right?
* You will see an estimate of 102099 rows here if you are using the pre-2014 cardinality estimation model.
The Cardinality Estimation Bug
The impossible Stream Aggregate estimate in our example is caused by a bug in cardinality estimation. It is an interesting example so we will explore it in a bit of detail.
Subquery Removal
It may surprise you to learn that the SQL Server query optimizer does not work with subqueries directly. They are removed from the logical query tree early in the compilation process, and replaced with an equivalent construction that the optimizer is set up to work with and reason about. The optimizer has a number of rules that remove subqueries. These can be listed by name using the following query (the referenced DMV is minimally documented, but not supported):
SELECT name
FROM sys.dm_exec_query_transformation_stats
WHERE name LIKE 'RemoveSubq%';
Results (on SQL Server 2014):

The combined test query has two predicates ("selections" in relational terms) on the history table, connected by OR. One of these predicates includes a subquery. The whole subtree (both predicates and the subquery) is transformed by the first rule in the list ("remove subquery in selection") to a semi-join over the union of the individual predicates. While it isn't possible to represent the result of this internal transformation exactly using T-SQL syntax, it is pretty close to being:
SELECT TH.TransactionID
FROM Production.TransactionHistory AS TH
WHERE EXISTS
(
    SELECT 1
    WHERE TH.ProductID = 421

    UNION ALL

    SELECT 1
    FROM Production.Product AS P
    WHERE P.Name = N'Metal Plate 2'
    AND P.ProductID = TH.ProductID
)
OPTION (QUERYRULEOFF ApplyUAtoUniSJ);
It is a little unfortunate that my T-SQL approximation of the internal tree after subquery removal contains a subquery, but in the language of the query processor it doesn't (it is a semi join). If you would prefer to see the raw internal form instead of my attempt at a T-SQL equivalent, please be assured that will be along momentarily.
The undocumented query hint included in the T-SQL above is there is to prevent a subsequent transformation for those of you that want to see the transformed logic in execution plan form. The annotations below show the positions of the two predicates after transformation:
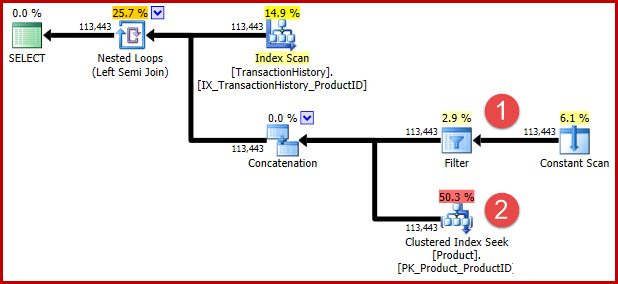
The intuition behind the transformation is that a history row qualifies if either of the predicates are satisfied. Regardless of how helpful you find my approximate T-SQL and execution plan illustration, I hope it is at least reasonably clear that the rewrite expresses the same requirement as the original query.
I should stress that the optimizer does not literally generate alternate T-SQL syntax or produce complete execution plans at intermediate stages. The T-SQL and execution plan representations above are intended purely an aid to comprehension. If you're interested in the raw details, the promised internal representation of the transformed query tree (slightly edited for clarity/space) is:
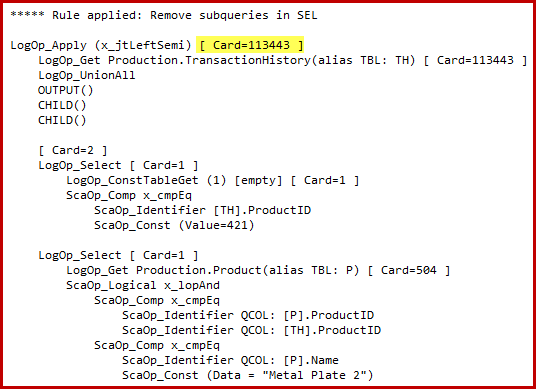
Notice the highlighted apply semi join cardinality estimate. It is 113443 rows when using the 2014 cardinality estimator (102099 rows if using the old CE). Bear in mind that the AdventureWorks history table contains 113443 rows in total, so this represents 100% selectivity (90% for the old CE).
We saw earlier that applying either of these predicates alone results in only a small number of matches: 19 rows for product ID 421, and 13 rows (estimated 257) for "Metal Plate 2". Estimating that the disjunction (OR) of the two predicates will return all rows in the base table seems entirely bonkers.
Bug Details
The details of the selectivity computation for the semi join are only visible in SQL Server 2014 when using the new cardinality estimator with (undocumented) trace flag 2363. It's probably possible to see something similar with Extended Events, but the trace flag output is more convenient to use here. The relevant section of the output is shown below:
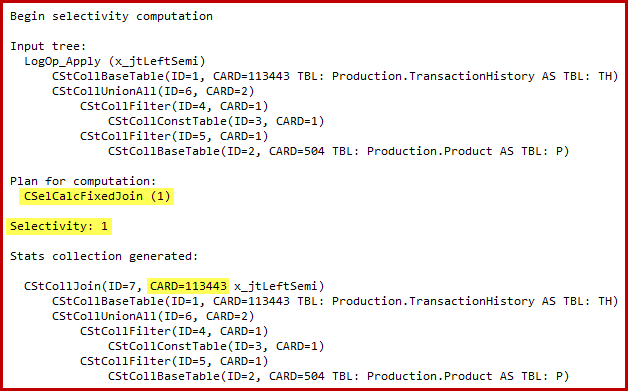
The cardinality estimator uses the Fixed Join calculator with 100% selectivity. As a consequence, the estimated output cardinality of the semi join is the same as its input, meaning all 113443 rows from the history table are expected to qualify.
The exact nature of the bug is that the semi join selectivity computation misses any predicates positioned beyond a union all in the input tree. In the illustration below, the lack of predicates on the semi join itself is taken to mean every row will qualify; it ignores the effect of predicates below the concatenation (union all).
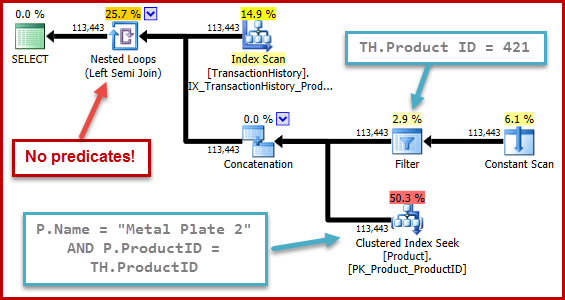
This behaviour is all the more surprising when you consider that selectivity computation is operating on a tree representation that the optimizer generated itself (the shape of the tree and the positioning of the predicates is the result of it removing the subquery).
A similar issue occurs with the pre-2014 cardinality estimator, but the final estimate is instead fixed at 90% of the estimated semi join input (for entertaining reasons related to a inversed fixed 10% predicate estimate that is too much of a diversion to get into).
Examples
As mentioned above, this bug manifests when estimation is performed for a semi join with related predicates positioned beyond a union all. Whether this internal arrangement occurs during query optimization depends on the original T-SQL syntax and the precise sequence of internal optimization operations. The following examples show some cases where the bug does and does not occur:
Example 1
This first example incorporates a trivial change to the test query:
SELECT TH.TransactionID
FROM Production.TransactionHistory AS TH
WHERE TH.ProductID = (SELECT 421) -- The only change
OR TH.ProductID =
(
    SELECT P.ProductID
    FROM Production.Product AS P
    WHERE P.Name = N'Metal Plate 2'
);
The estimated execution plan is:
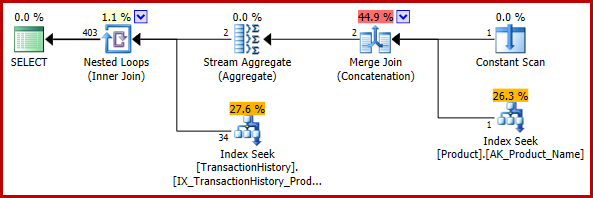
The final estimate of 403 rows is inconsistent with the nested loops join's input estimates, but it is still a reasonable one (in the sense discussed earlier). If the bug had been encountered, the final estimate would be 113443 rows (or 102099 rows when using the pre-2014 CE model).
Example 2
In case you were about to rush out and rewrite all your constant comparisons as trivial subqueries to avoid this bug, look what happens if we make another trivial change, this time replacing the equality test in the second predicate with IN. The meaning of the query remains unchanged:
SELECT TH.TransactionID
FROM Production.TransactionHistory AS TH
WHERE TH.ProductID = (SELECT 421) -- Change 1
OR TH.ProductID IN                -- Change 2
(
    SELECT P.ProductID
    FROM Production.Product AS P
    WHERE P.Name = N'Metal Plate 2'
);
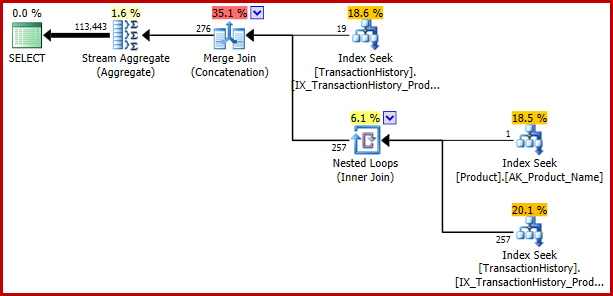
The bug returns:
Example 3
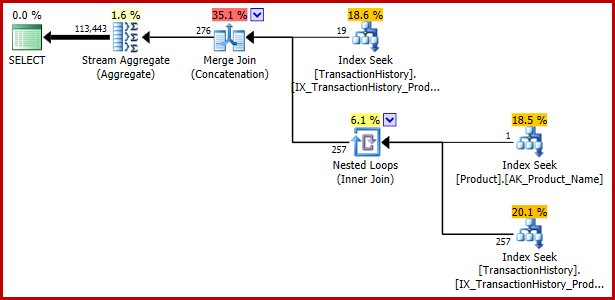
Although this article has so far concentrated on a disjunctive predicate containing a subquery, the following example shows that the same query specification expressed using EXISTS and UNION ALL is also vulnerable:
SELECT TH.TransactionID
FROM Production.TransactionHistory AS TH
WHERE EXISTS
(
    SELECT 1
    WHERE TH.ProductID = 421
    UNION ALL
    SELECT 1
    FROM Production.Product AS P
    WHERE P.Name = N'Metal Plate 2'
    AND P.ProductID = TH.ProductID
);
Execution plan:
Example 4
Here are two more ways to express the same logical query in T-SQL:
SELECT TH.TransactionID
FROM Production.TransactionHistory AS TH
WHERE TH.ProductID = 421
UNION
SELECT TH.TransactionID
FROM Production.TransactionHistory AS TH
WHERE TH.ProductID =
(
    SELECT P.ProductID
    FROM Production.Product AS P
    WHERE P.Name = N'Metal Plate 2'
);

SELECT TH.TransactionID
FROM Production.TransactionHistory AS TH
WHERE TH.ProductID = 421
UNION
SELECT TH.TransactionID
FROM Production.TransactionHistory AS TH
JOIN Production.Product AS P
    ON P.ProductID = TH.ProductID
    AND P.Name = N'Metal Plate 2';
Neither query encounters the bug, and both produce the same execution plan:
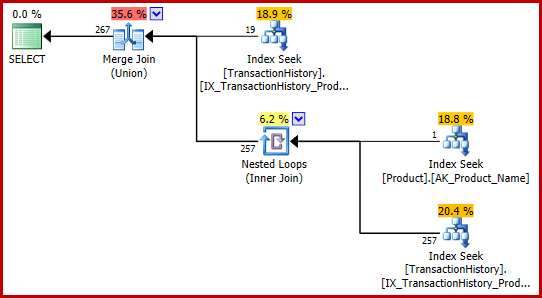
These T-SQL formulations happen to produce an execution plan with entirely consistent (and reasonable) estimates.
Example 5
You may be wondering if the inaccurate estimation is important. In the cases presented so far, it isn't, at least not directly. Problems arise when the bug occurs in a larger query, and the incorrect estimate affects optimizer decisions elsewhere. As a minimally-extended example, consider returning the results of our test query in a random order:
SELECT TH.TransactionID
FROM Production.TransactionHistory AS TH
WHERE TH.ProductID = 421
OR TH.ProductID =
(
    SELECT P.ProductID
    FROM Production.Product AS P
    WHERE P.Name = N'Metal Plate 2'
)
ORDER BY NEWID(); -- New
The execution plan shows the incorrect estimate affects later operations. For example, it is the basis for the memory grant reserved for the sort:
If you would like to see a more real-world example of this bug's potential impact, take a look at this recent question from Richard Mansell on the SQLPerformance.com Q & A site, answers.SQLPerformance.com.
Summary and Final Thoughts
This bug is triggered when the optimizer performs cardinality estimation for a semi join, in specific circumstances. It is a challenging bug to spot and work around for a number of reasons:
- There is no explicit T-SQL syntax to specify a semi join, so it is hard to know in advance if a particular query will be vulnerable to this bug.
- The optimizer can introduce a semi join in a wide variety of circumstances, not all of which are obvious semi join candidates.
- The problematic semi join is often transformed to something else by later optimizer activity, so we can't even rely on there being a semi join operation in the final execution plan.
- Not every weird-looking cardinality estimate is caused by this bug. Indeed, many examples of this type are an expected and harmless side-effect of normal optimizer operation.
- The erroneous semi join selectivity estimate will always be 90% or 100% of its input, but this will not usually correspond to the cardinality of a table used in the plan. Furthermore, the semi join input cardinality used in the calculation may not even be visible in the final execution plan.
- There are typically many ways to express the same logical query in T-SQL. Some of these will trigger the bug, while others will not.
These considerations make it difficult to offer practical advice to spot or work around this bug. It is certainly worthwhile checking execution plans for "outrageous" estimates, and investigating queries with performance that is much worse than expected, but both of these may have causes that do not relate to this bug. That said, it worth particularly checking queries that include a disjunction of predicates and a subquery. As the examples in this article show, this is not the only way to encounter the bug, but I expect it to be a common one.
If you're lucky enough to be running SQL Server 2014, with the new cardinality estimator enabled, you may be able to confirm the bug by manually checking trace flag 2363 output for a fixed 100% selectivity estimation on a semi join, but this is hardly convenient. You will not want to be using undocumented trace flags on a production system, naturally.
The User Voice bug report for this issue can be found here. Please vote and comment if you would like to see this issue investigated (and possibly fixed).




Thank you so much for this article!
I thought I was going crazy, and thanks to your article I was able to produce a workaround that fixed my problem. I spent two days trying to understand why mssql produced not optimal execution plan, and who knows how much more time I would spend…
Thanks for letting me know, Andrey. It's always great to hear when technical details are useful in solving a real-world problem!
Thank you so much. I've been hitted by this bug today.
Aha! I think I've been running into this with queries on an updatable partitioned view.
Add it to my list of repros to work on :-)