
Knee-Jerk Wait Statistics : PAGEIOLATCH_SH
In my posts this year I've been discussing the knee-jerk reactions to various wait types, and in this post I'm going to continue with the wait statistics theme and discuss the PAGEIOLATCH_XX wait. I say "wait" but there are really multiple kinds of PAGEIOLATCH waits, which I've signified with the XX at the end. The most common examples are:
PAGEIOLATCH_SH– (SHare) waiting for a data file page to be brought from disk into the buffer pool so its contents can be readPAGEIOLATCH_EXorPAGEIOLATCH_UP– (EXclusive or UPdate) waiting for a data file page to be brought from disk into the buffer pool so its contents can be modified
Of these, by far the most common type is PAGEIOLATCH_SH.
When this wait type is the most prevalent on a server, the knee-jerk reaction is that the I/O subsystem must have a problem and so that's where investigations should be focused.
The first thing to do is to compare the PAGEIOLATCH_SH wait count and duration against your baseline. If the volume of waits is more or less the same, but the duration of each read wait has become much longer, then I'd be concerned about an I/O subsystem problem, such as:
- A misconfiguration/malfunction at the I/O subsystem level
- Network latency
- Another I/O workload causing contention with our workload
- Configuration of synchronous I/O-subsystem replication/mirroring
In my experience, the pattern is often that the number of PAGEIOLATCH_SH waits has increased substantially from the baseline (normal) amount and the wait duration has also increased (i.e. the time for a read I/O has increased), because the large number of reads overloads the I/O subsystem. This isn't an I/O subsystem problem – this is SQL Server driving more I/Os than it should be. The focus now needs to switch to SQL Server to identify the cause of the extra I/Os.
Causes of Large Numbers of Read I/Os
SQL Server has two types of reads: logical I/Os and physical I/Os. When the Access Methods portion of the Storage Engine needs to access a page, it asks the Buffer Pool for a pointer to the page in memory (called a logical I/O) and the Buffer Pool checks through its metadata to see if that page is already in memory.
If the page is in memory, the Buffer Pool gives the Access Methods the pointer, and the I/O remains a logical I/O. If the page is not in memory, the Buffer Pool issues a "real" I/O (called a physical I/O) and the thread has to wait for it to complete – incurring a PAGEIOLATCH_XX wait. Once the I/O completes and the pointer is available, the thread is notified and can continue running.
In an ideal world your entire workload would fit in memory and so once the buffer pool has "warmed up" and holds all the workload, no more reads are required, only writes of updated data. It's not an ideal world though, and most of you don't have that luxury, so some reads are inevitable. As long as the number of reads stays around your baseline amount, there's no problem.
When a large number of reads are required suddenly and unexpectedly, that's a sign that there's a significant change in either the workload, the amount of buffer pool memory available for storing in-memory copies of pages, or both.
Here are some possible root causes (not an exhaustive list):
- External Windows memory pressure on SQL Server causing the memory manager to reduce the buffer pool size
- Plan cache bloat causing extra memory to be borrowed from the buffer pool
- A query plan doing a table/clustered index scan (instead of an index seek) because of:
- a workload volume increase
- a parameter sniffing problem
- a required nonclustered index that was dropped or changed
- an implicit conversion
One pattern to look for that would suggest a table/clustered index scan being the cause is also seeing a large number of CXPACKET waits along with the PAGEIOLATCH_SH waits. This is a common pattern that indicates large, parallel table/clustered index scans occurring.
In all cases, you could look at what query plan is causing the PAGEIOLATCH_SH waits using the sys.dm_os_waiting_tasks and other DMVs, and you can get code to do that in my blog post here. If you have a third-party monitoring tool available, it may be able to help you identify the culprit without getting your hands dirty.
Example Workflow with SQL Sentry and Plan Explorer
In a simple (obviously contrived) example, let's assume that I'm on a client system using SQL Sentry's suite of tools and see a spike in I/O waits in the dashboard view of SQL Sentry, as shown below:
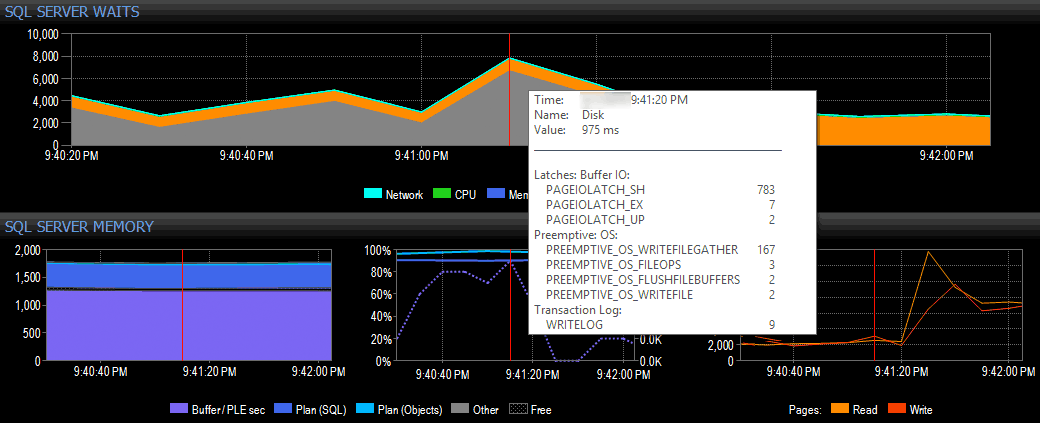
Spotting a spike in I/O waits in SQL Sentry
I decide to investigate by right-clicking a selected time interval around the time of the spike, then jumping over to the Top SQL view, which is going to show me the most expensive queries that have executed:
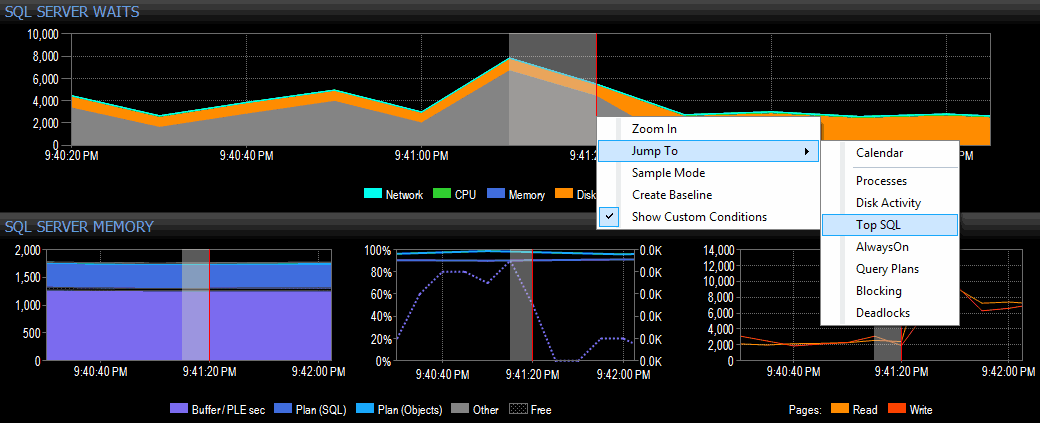
Highlighting a time range and navigating to Top SQL
In this view, I can see which long-running or high I/O queries were running at the time the spike occurred, and then choose to drill in to their query plans (in this case, there is just one long-running query, which ran for nearly a minute):
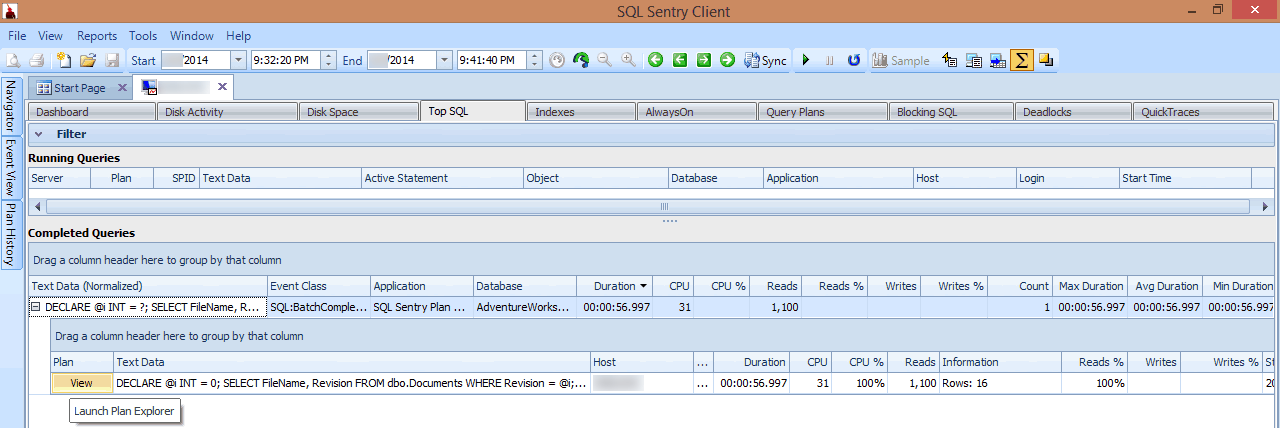
Reviewing a long-running query in Top SQL
If I look at the plan in the SQL Sentry client or open it in SQL Sentry Plan Explorer, I immediately see multiple problems. The number of reads required to return 7 rows seems far too high, the delta between estimated and actual rows is large, and the plan shows an index scan occurring where I would have expected a seek:
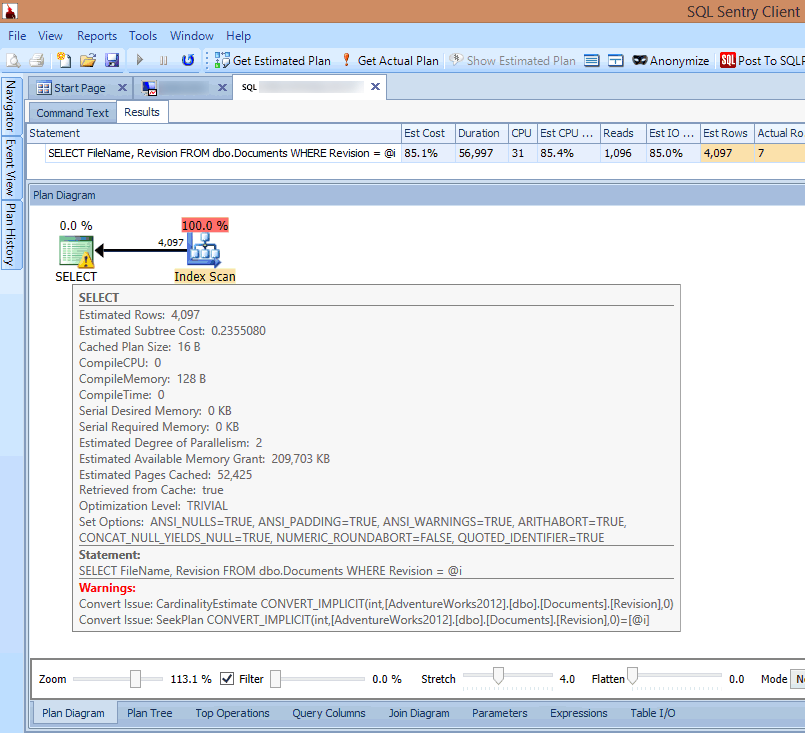
Seeing implicit conversion warnings in the query plan
The cause of all this is highlighted in the warning on the SELECT operator: It's an implicit conversion!
Implicit conversions are an insidious problem caused by a mismatch between the search predicate data type and the data type of the column being searched, or a calculation being performed on the table column rather than the search predicate. In either case, SQL Server cannot use an index seek on the table column and must use a scan instead.
This can crop up in seemingly innocent code, and a common example is using a date calculation. If you have a table that stores the age of customers, and you want to perform a calculation to see how many are 21 years old or over today, you might write code like this:
WHERE DATEADD (YEAR, 21, [MyTable].[BirthDate]) <= @today;With this code, the calculation is on the table column and so an index seek cannot be used, resulting in an unseekable expression (technically known as a non-SARGable expression) and a table/clustered index scan. This can be solved by moving the calculation to the other side of the operator:
WHERE [MyTable].[BirthDate] <= DATEADD (YEAR, -21, @today);In terms of when a basic column comparison requires a data type conversion that can cause an implicit conversion, my colleague Jonathan Kehayias wrote an excellent blog post that compares every combination of data types and notes when an implicit conversion will be required.
Summary
Don't fall into the trap of thinking that excessive PAGEIOLATCH_XX waits are caused by the I/O subsystem. In my experience they're usually caused by something to do with SQL Server and that's where I'd start troubleshooting.
As far as general wait statistics are concerned, you can find more information about using them for performance troubleshooting in:
- My SQLskills blog post series, starting with Wait statistics, or please tell me where it hurts
- My Wait Types and Latch Classes library here
- My Pluralsight online training course SQL Server: Performance Troubleshooting Using Wait Statistics
- SQL Sentry
In the next article in the series, I'll discuss another wait type that is a common cause of knee-jerk reactions. Until then, happy troubleshooting!
13 thoughts on “Knee-Jerk Wait Statistics : PAGEIOLATCH_SH”
Comments are closed.
I saw other bloggers and sql book authors say that
•PAGEIOLATCH_SH and PAGEIOLATCH_EX or PAGEIOLATCH_UP are for both reading and writing from/to disk. Paul could you confirm if it is true? When dirty data pages write to disk, does it require latches?
No – PAGEIOLATCH_XX are for reading pages from disk. Yes, when dirty page is written to disk is requires a buffer latch.
Is Paul Randal using a third party tool? Never thought I see it. :) As always, great post. Don't forget about PS, nothing from you on there for awhile.
Very good and informative post. I have seen this happen multiple times either because of parameter sniffing or implicit conversion.
Hi There,
I'm no DBA but I'm looking at an application performance issue which has taken me to this blog post. I suspect the bottleneck is either disk I/O or memory but looking at the performance monitors of the SAN everything looks fine. I found the below query on a forum and am trying to apply what you've said below to the resultant output (also below) but I'm a little confused. Is there anything you deduce from my stats?
SELECT
wait_time_ms – signal_wait_time_ms as io_latch,
wait_type,
waiting_tasks_count,
wait_time_ms,
signal_wait_time_ms
FROM sys.dm_os_wait_stats
WHERE wait_type LIKE 'PAGEIOLATCH%' or wait_type LIKE 'CXPACKET%'
ORDER BY wait_type
io_latch wait_type waiting_tasks_count wait_time_ms signal_wait_time_ms
4636 CXPACKET 5163 4854 218
0 PAGEIOLATCH_DT 0 0 0
5080149 PAGEIOLATCH_EX 5613401 5087985 7836
0 PAGEIOLATCH_KP 0 0 0
0 PAGEIOLATCH_NL 0 0 0
52842430 PAGEIOLATCH_SH 14004092 53131941 289511
25625 PAGEIOLATCH_UP 9277 25683 58
The average read wait from your stats is only ~4ms, so the problem isn't a bottleneck at the I/O subsystem level. Run the script from http://www.sqlskills.com/blogs/paul/wait-statistics-or-please-tell-me-where-it-hurts/ to see what the top waits are.
This helped a lot with a problem that I was facing. There does seem to be an issue with the code examples. WordPress or whatever blogging software is being used does not seem to be rendering the "less than" symbol correctly. Here is what my browser shows: WHERE DATEADD (YEAR, 21, [MyTable].[BirthDate]) <= @today;
Sorry about that, WordPress sometimes "protects" authors from scary HTML. :-)
Hey Paul,
I don't have NUMA node in my environment with 8 CPUs and 62 GB of RAM. I always notice, my sessions are registering PAGEIOLATCH and MEMORY_ALLOC_EXT waits. Is it happening because of the absence of NUMA?
No – those have nothing to do with the presence of NUMA.