One of the many execution plan improvements in SQL Server 2012 was the addition of thread reservation and usage information for parallel execution plans. This post looks at exactly what these numbers mean, and provides additional insights into understanding parallel execution.
Consider the following query run against an enlarged version of the AdventureWorks database:
SELECT
    BP.ProductID,
    cnt = COUNT_BIG(*)
FROM dbo.bigProduct AS BP
JOIN dbo.bigTransactionHistory AS BTH
    ON BTH.ProductID = BP.ProductID
GROUP BY BP.ProductID
ORDER BY BP.ProductID;
The query optimizer chooses a parallel execution plan:

Plan Explorer shows parallel thread usage details in the root node tooltip. To see the same information in SSMS, click on the plan root node, open the Properties window, and expand the ThreadStat node. Using a machine with eight logical processors available for SQL Server to use, the thread usage information from a typical run of this query is shown below, Plan Explorer on the left, SSMS view on the right:

The screenshot shows the execution engine reserved 24 threads for this query, and wound up using 16 of them. It also shows that the query plan has three branches, though it does not say exactly what a branch is. If you have read my Simple Talk article on parallel query execution, you will know that branches are sections of a parallel query plan bounded by exchange operators. The diagram below draws the boundaries, and numbers the branches (click to enlarge):
Branch Two (Orange)
Let's look at branch two in a bit more detail first:
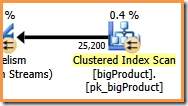
At a degree of parallelism (DOP) of eight, there are eight threads running this branch of the query plan. It is important to understand that this is the entire execution plan as far as these eight threads are concerned – they have no knowledge of the wider plan.
In a serial execution plan, a single thread reads data from a data source, processes the rows through a number of plan operators, and returns results to the destination (which might be an SSMS query results window or a database table, for example).
In a branch of a parallel execution plan, the situation is very similar: each thread reads data from a source, processes the rows through a number of plan operators, and returns results to the destination. The differences are that the destination is an exchange (parallelism) operator, and the data source can also be an exchange.
In the orange branch, the data source is a Clustered Index Scan, and the destination is the right-hand side of a Repartition Streams exchange. The right-hand side of an exchange is known as the producer side, because it connects to a branch that adds data to the exchange.
The eight threads in the orange branch co-operate to scan the table and add rows to the exchange. The exchange assembles rows into page-sized packets. Once a packet is full it is pushed across the exchange to the other side. If the exchange has another empty packet available to fill, the process continues until all data source rows have been processed (or the exchange runs out of empty packets).
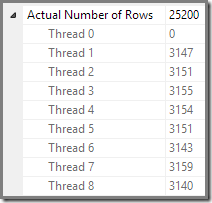
We can see the number of rows processed on each thread using the Plan Tree view in Plan Explorer:

Plan Explorer makes it easy to see how rows are distributed across threads for all the physical operations in the plan. In SSMS, you are limited to seeing row distribution for a single plan operator. To do this, click an operator icon, open the Properties window, and then expand the Actual Number of Rows node. The graphic below shows SSMS information for the Repartition Streams node at the border between the orange and purple branches:
Branch Three (Green)

Branch three is similar to branch two, but it contains an extra Stream Aggregate operator. The green branch also has eight threads, making a total of sixteen seen so far. The eight green-branch threads read data from a Nonclustered Index Scan, perform some sort of aggregation, and pass the results to the producer side of another Repartition Streams exchange.
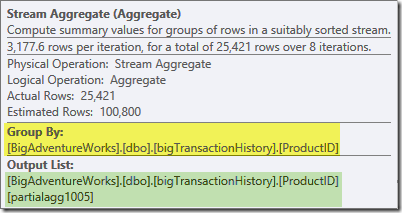
The Plan Explorer tooltip for the Stream Aggregate shows it is grouping by product ID and computing an expression labeled partialagg1005:
The Expressions tab shows the expression is the result of counting the rows in each group:

The Stream Aggregate is computing a partial (also known as 'local') aggregate. The partial (or local) qualifier simply means that each thread computes the aggregate on the rows it sees. Rows from the Index Scan are distributed between threads using a demand-based scheme: there is no fixed distribution of rows ahead of time; threads receive a range of rows from the scan as they ask for them. Which rows end up on which threads is essentially random because it depends on timing issues and other factors.
Each thread sees different rows from the scan, but rows with the same product ID may be seen by more than one thread. The aggregate is 'partial' because subtotals for a particular product ID group can appear on more than one thread; it is 'local' because each thread computes its result based only on the rows it happens to receive. For example, say there are 1,000 rows for product ID #1 in the table. One thread might happen to see 432 of those rows, while another might see 568. Both threads will have a partial count of rows for product ID #1 (432 in one thread, 568 in the other).
Partial aggregation is a performance optimization because it reduces row counts earlier than would otherwise be possible. In the green branch, early aggregation results in fewer rows being assembled into packets and pushed across the Repartition Stream exchange.
Branch 1 (Purple)
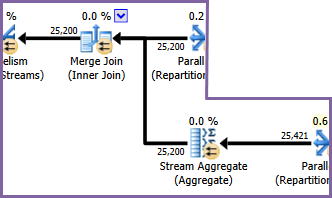
The purple branch has eight more threads, making twenty-four so far. Each thread in this branch reads rows from the two Repartition Streams exchanges, and writes rows to a Gather Streams exchange. This branch may seem complicated and unfamiliar, but it is just reading rows from a data source and sending results to a destination, like any other query plan.
The right hand side of the plan shows data being read from the other side of the two Repartition Streams exchanges seen in the orange and green branches. This (left hand) side of the exchange is known as the consumer side, because threads attached here are reading (consuming) rows. The eight purple branch threads are consumers of data at the two Repartition Streams exchanges.
The left hand side of the purple branch shows rows being written to the producer side of a Gather Streams exchange. The same eight threads (that are consumers at the Repartition Streams exchanges) are performing a producer role here.
Each thread in the purple branch runs every operator in the branch, just as a single thread executes every operation in a serial execution plan. The main difference is that there are eight threads running concurrently, each working on a different row at any given moment in time, using different instances of the query plan operators.
The Stream Aggregate in this branch is a global aggregate. It combines the partial (local) aggregates computed in the green branch (remember the example of a 432 count in one thread and 568 in the other) to produce a combined total for each product ID. The Plan Explorer tooltip shows the global result expression, labelled Expr1004:
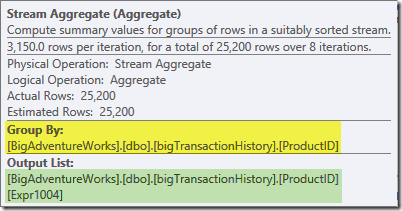
The correct global result per Product ID is computed by summing the partial aggregates, as the Expressions tab illustrates:
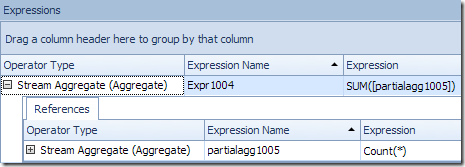
To continue our (imaginary) example, the correct result of 1,000 rows for product ID #1 is obtained by summing the two subtotals of 432 and 568.
Each of the eight purple branch threads reads data from the consumer side of the two Gather Streams exchanges, computes the global aggregates, performs the Merge Join on product ID, and adds rows to the Gather Streams exchange on the far left of the purple branch. The core process is not very much different from an ordinary serial plan; the differences are in where rows are read from, where they are sent to, and how rows are distributed between the threads…
Exchange Row Distribution
The alert reader will be wondering about a couple of details at this point. How does the purple branch manage to compute correct results per product ID but the green branch could not (results for the same product ID were spread across many threads)? Also, if there are eight separate merge joins (one per thread) how does SQL Server guarantee that rows that will join end up at the same instance of the join?
Both of these questions can be answered by looking at the way the two Repartition Streams exchanges route rows from the producer side (in the green and orange branches) to the consumer side (in the purple branch). We will look at the Repartition Streams exchange bordering the orange and purple branches first:
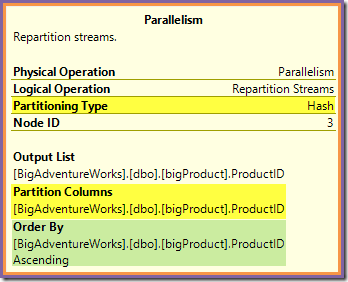
This exchange routes incoming rows (from the orange branch) using a hash function applied to the product ID column. The effect is that all rows for a particular product ID are guaranteed to be routed to the same purple-branch thread. The orange and purple threads know nothing of this routing; all this is handled internally by the exchange.
All the orange threads know is that they are returning rows to the parent iterator that asked for them (the producer side of the exchange). Equally, all the purple threads 'know' is that they are reading rows from a data source. The exchange determines which packet an incoming orange-thread row will go into, and it could be any one of eight candidate packets. Similarly, the exchange determines which packet to read a row from to satisfy a read request from a purple thread.
Be careful not to acquire a mental image of a particular orange (producer) thread being linked directly to a particular purple (consumer) thread. That is not how this query plan works. An orange producer may end up sending rows to all purple consumers – the routing depends entirely on the value of the product ID column in each row it processes.
Also note that a packet of rows at the exchange is only transferred when it is full (or when the producer side runs out of data). Imagine the exchange filling packets a row at a time, where rows for a particular packet may come from any of the producer-side (orange) threads. Once a packet is full, it is passed across to the consumer side, where a particular consumer (purple) thread can start reading from it.
The Repartition Streams exchange bordering the green and purple branches works in a very similar way:
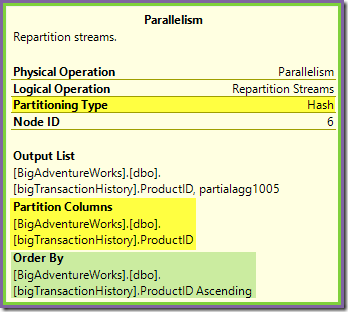
Rows are routed to packets in this exchange using the same hash function on the same partitioning column as for the orange-purple exchange seen previously. This means that both Repartition Streams exchanges route rows with the same product ID to the same purple-branch thread.
This explains how the Stream Aggregate in the purple branch is able to compute global aggregates – if one row with a particular product ID is seen on a particular purple-branch thread, that thread is guaranteed to see all rows for that product ID (and no other thread will).
The common exchange partitioning column is also the join key for the merge join, so all rows that can possibly join are guaranteed to be processed by the same (purple) thread.
A final thing to note is that both exchanges are order-preserving (a.k.a 'merging') exchanges, as shown in the Order By attribute in the tooltips. This meets the merge join requirement that input rows be sorted on the join keys. Note that exchanges never sort rows themselves, they can just be configured to preserve existing order.
Thread Zero

The final part of the execution plan lies to the left of the Gather Streams exchange. It always runs on a single thread – the same one used to run the whole of a regular serial plan. This thread is always labelled 'Thread 0' in execution plans and is sometimes called the 'coordinator' thread (a designation I don't find particularly helpful).
Thread zero reads rows from the consumer (left) side of the Gather Streams exchange and returns them to the client. There are no thread zero iterators aside from the exchange in this example, but if there were, they would all run on the same single thread. Note the Gather Streams is also a merging exchange (it has an Order By attribute):
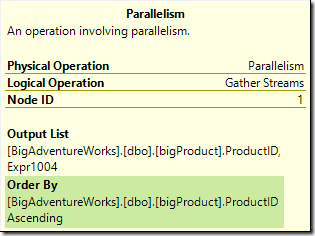
More complex parallel plans can include serial execution zones other than the one to the left of the final Gather Streams exchange. These serial zones are not run in thread zero, but that is a detail to explore another time.
Reserved and used threads revisited

We have seen that this parallel plan contains three branches. This explains why SQL Server reserved 24 threads (three branches at DOP 8). The question is why only 16 threads are reported as 'used' in the screenshot above.
There are two parts to the answer. The first part does not apply to this plan, but it is important to know about anyway. The number of branches reported is the maximum number that can be executing concurrently.
As you may know, certain plan operators are 'blocking' – meaning they have to consume all of their inputs rows before they can produce the first output row. The clearest example of a blocking (also known as stop-and-go) operator is Sort. A sort cannot return the first row in sorted sequence before it has seen every input row because the last input row might sort first.
Operators with multiple inputs (joins and unions, for example) can be blocking with respect to one input, but non-blocking ('pipelined') with respect to the other. An example of this is hash join – the build input is blocking, but the probe input is pipelined. The build input is blocking because it creates the hash table against which probe rows are tested.
The presence of blocking operators means that one or more parallel branches might be guaranteed to complete before others can start. Where this occurs, SQL Server can reuse the threads used to process a completed branch for a later branch in the sequence. SQL Server is very conservative about thread reservation, so only branches that are guaranteed to complete before another commences make use of this thread-reservation optimization. Our query plan does not contain any blocking operators, so the reported branch count is just the total number of branches.
The second part of the answer is that threads may still be reused if they happen to complete before a thread in another branch starts up. The full number of threads is still reserved in this case, but the actual usage may be lower. How many threads a parallel plan actually uses depends on timing issues among other things, and can vary between executions.
Parallel threads do not all start executing at the same time, but again the details of that will have to wait for another occasion. Let's look at the query plan again to see how threads might be reused, despite the lack of blocking operators:
It is clear that threads in branch one cannot complete before threads in branches two or three start up, so there is no chance of thread reuse there. Branch three is also unlikely to complete before either branch one or branch two start up because it has so much work to do (almost 32 million rows to aggregate).
Branch two is a different matter. The relatively small size of the product table means there is a decent chance that the branch can complete its work before branch three starts up. If reading the product table does not result in any physical I/O, it will not take very long for eight threads to read the 25,200 rows and submit them to the orange-purple boundary Repartition Streams exchange.
This is exactly what happened in the test runs used for the screenshots seen so far in this post: the eight orange branch threads completed quickly enough that they could be reused for the green branch. In total, sixteen unique threads were used, so that is what the execution plan reports.
If the query is re-run with a cold cache, the delay introduced by the physical I/O is enough to ensure that green branch threads start up before any orange branch threads have completed. No threads are reused, so the execution plan reports that all 24 reserved threads were in fact utilized:

More generally, any number of 'used threads' between the two extremes (16 and 24 for this query plan) is possible:

Finally, note that the thread that runs the serial part of the plan to the left of the final Gather Streams is not counted in the parallel thread totals. It is not an extra thread added to accommodate parallel execution.
Final Thoughts
The beauty of the exchange model used by SQL Server to implement parallel execution is that all the complexity of buffering and moving rows between threads is hidden inside exchange (Parallelism) operators. The rest of the plan is split into neat 'branches', bounded by exchanges. Within a branch, each operator behaves the same as it does in a serial plan – in almost all cases, the branch operators have no knowledge that the wider plan uses parallel execution at all.
The key to understanding parallel execution is to (mentally) break the parallel plan apart at the exchange boundaries, and to picture each branch as DOP separate serial plans, all executing concurrency on a distinct subset of rows. Remember in particular that each such serial plan runs all the operators in that branch – SQL Server does not run each operator on its own thread!
Understanding the most detailed behaviour does require a bit of thought, particularly as to how rows are routed within exchanges, and how the engine guarantees correct results, but then most things worth knowing require a bit of thought, don't they?


Greatly depicted mental image of how parallelism works, worthy follower of the older article from simple talk. Thanks Paul!
I have one small note/question, about accounting single thread part. I’ve been playing with column store indexes in 2014CTP1 and noticed that in a mixed mode in 2014 there are actually 5 reserved threads (though 4 used) for DOP 4 and one branch, 9 reserved (8 used) for DOP 4 and two branches, and so on. It is also interesting that if we have two nonparallel parts of a plan, the threads are accounted respectively 6 reserved and 5 used. My guess would be 4 for one branch and 2 more for non-parallel zones, but of course it is a guess and needs investigation.
Plans Image
I thought it might be curious regarding to the topic.
Paul's not one for brevity but his articles on parallelism are the best ever written. Period.
Thanks Paul.
Paul,
Would you, at some point, be willing to write an article detailing the differences in execution flow between this "ordinary" parallelism and the newer batch mode that also requires parallelism? I understand that in the latter case a batch is treated as a unit when it comes to CPU instructions but would like to understand this in greater detail. Thanks much!
Sure. Thanks for the suggestion.
Hi Paul,
From your post, does this mean a thread just run inside a branch, when it reach the exchange operators, it package data and route to another thread on the other side? would you please correct me this point.
Thanks
That's right.
Without looking at execution plan is there a way to see reserve number of threads (may be a DMV). For example someone is trying to troubleshoot 'there are not enough available worker threads' error message.
sys.dm_exec_query_stats and sys.dm_exec_requests have information about reserved threads from 2016 onward. For previous versions, might make an interesting question for https://dba.stackexchange.com/ maybe something could be worked out.
Paul,
When a reserved thread is "re-used" by a different branch, does the task_address get re-used or does the thread take on a new task_address?
I have some scripts that attempt to map rows in dm_os_tasks/dm_os_waits to the branch they belong to. This is quite a complicated task as I'm sure you know and I won't belabor the details, but knowing whether a task_address is "static" to a branch (even if the underlying thread isn't) would be nice for that effort.
Thanks,
Aaron
It's a different task, so it has a different task address.