


One of the toughest challenges in SQL Server is troubleshooting problems with parameter sensitivity or cardinality estimation that cause performance degradation of a workload. Generally you'll need to have the actual execution plan from the statement running to be able to determine the cause of the performance degradation. In SQL Server 2012, the query_post_execution_showplan Extended Event provides the ability to capture the actual execution plan for statements. However, as useful as this seems, this event is not something that can be used without a significant performance impact on the workload running on the server.
In my article Measuring “Observer Overhead” of SQL Trace vs. Extended Events, I showed a comparison of the performance impact of SQL Trace against an identical configuration using Extended Events in SQL Server 2012. At the time I originally did the testing for that article I also did a lot of testing of the query_post_execution_showplan event in SQL Server 2012. This event was first introduced in SQL Server 2012 CTP1 when many of the trace events were ported over to Extended Events to provide parity with SQL Trace. At that time the event only had a subset of the columns that were included in the final RTM of SQL Server 2012.
During CTP1 I submitted a Connect item requesting that an action be created to allow the collection of the actual execution plan with events in SQL Server 2012. The goal was to be able to use the module_end or sql_statement_completed events to identify when the execution of a procedure or statement exceeds its normal duration. For example, in the scenario of parameter sensitivity, where a less ideal plan is generated for the normal parameter values, the event can be used to collect the actual execution plan for that statement through an action. In response, the SQL Server team added the duration and cpu_time columns to the query_post_execution_showplan event to allow for predicate definitions to only collect this event for those scenarios.
Unfortunately this doesn’t have the same benefits that an implementation as an action would have had on performance. In the rest of this post I’ll explain why.
Performance Impact
At the time that I did the testing for my previous article, I also tested the overhead associated with the query_post_execution_showplan event, primarily because I was really interested in using it in a couple of client production systems and before I did so I needed to understand what kind of impact the event would have on their workload. I was really dismayed by the results I got from my original tests, and after having Aaron Bertrand validate my results using SQL Sentry's in-house test harness, I filed another Connect item reporting the performance issues which has subsequently been closed as “By Design”.
For testing the performance impact, the exact same workload and Distributed Replay configuration from the Measuring “Observer Overhead” of SQL Trace vs. Extended Events article was used. The only difference for the test results shown in this article is that a newer, more powerful host system was used for the VM environment. The VMs used were exactly the same, with no changes to their configuration, and they were simply copied to the new system which is why the baseline workload was able to perform the replay faster with a higher average Batch Requests/sec. The baseline results were captured using a standard SQL Server 2012 installation with only the default system_health event session running on the server.
For the comparison of the performance impact of the query_post_execution_showplan event, the following event session definition was used.
CREATE EVENT SESSION [query_post_execution_showplan Overhead]
ON SERVER
ADD EVENT sqlserver.query_post_execution_showplan(
WHERE ([duration]=(5000000)));
GO
This session does not actually collect the event data using a target and uses a predicate on the duration for the event duration equals 5000000 microseconds, or five seconds duration. For the replay workload, no statement executing has a duration of exactly five second, so the query_post_execution_showplan event never actually fires in the server, and any performance degradation is strictly the result of the event data collection and then predicate evaluation. The results from the tests are shown in Table 1 and charted in Chart 2.
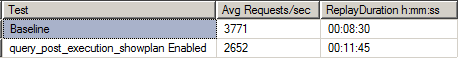
Table 1 – query_post_execution event overhead
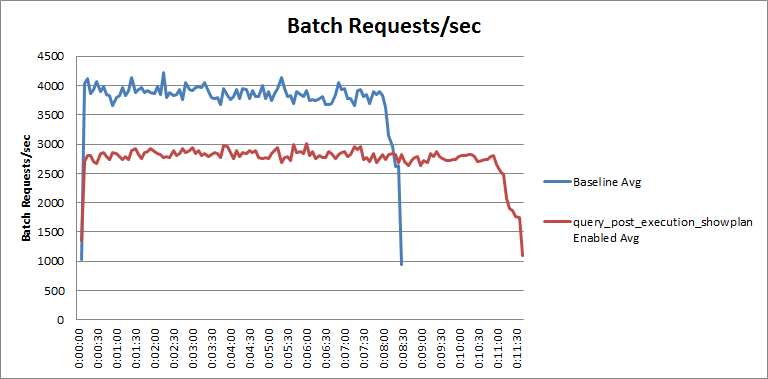
Chart 2 – query_post_execution event overhead
For this round of tests, the performance of the workload degrades by roughly 30% by simply having this event enabled in an event session, even though it won’t fire for any of the events that are being replayed on the server. The overall degradation will depend on the actual workload for the server, and it is important to note that this series of tests reflects more of a worst case scenario since the Distributed Replay was run in stress mode and the CPU usage on the SQL Server was pegged at 94% on average during the tests.
Understanding the Performance Impact
The reason that this event imposes such a significant overhead on performance can be explained from the event lifecycle in Extended Events. When a critical point in the SQL Server code associated with an event is encountered during execution, the code performs a very fast Boolean check to determine if the event is enabled in any active event session on the server. If the event is enabled for an active event session, all the data columns associated with the event are collected, including any customizable columns that have been turned on. At this point the event evaluates any predicates for the active event sessions that are collecting the event to determine if the event will actually fire completely.
For the query_post_exection_showplan event, all of the performance impact is from the overhead associated with the data collection. Even in the case where there is a predicate for duration equal to five seconds, just by turning the event on in an event session, it has to collect the Showplan XML for every statement that executes on the server just to be able to evaluate the predicate and then determine that the event won’t fire. For this reason, the query_post_execution_showplan event should be avoided for production workloads. For the test replay workload, the event had to be evaluated roughly 440,000 times, even though it doesn’t actually fire for the workload and event session being tested since none of the replay events has a duration of exactly five seconds. The event count information was collected by adding the event_counter target to the event session and removing the duration predicate and then retesting the replay workload with the following session definition.
CREATE EVENT SESSION [query_post_execution_showplan Overhead]
ON SERVER
ADD EVENT sqlserver.query_post_execution_showplan
ADD TARGET package0.event_counter;
GO
Comparison to Rapidly Firing Events
To provide a frame of reference for this performance impact we can look at the overhead of turning on a set of frequently executing events in the server and performing the same replay workload. Two of the most frequently executed events in SQL Server are the lock_acquired and lock_released events. To compare the overhead of these two events, the following event session can be used, which collects the events with no predicate so that every execution is collected and counts how frequently they fire using the event_counter target.
CREATE EVENT SESSION [locking Overhead]
ON SERVER
ADD EVENT sqlserver.lock_acquired,
ADD EVENT sqlserver.lock_released
ADD TARGET package0.event_counter;
GO
For our replay workload, these two events fire roughly 111,180,000 times. The overhead associated with collecting these events can be seen in Table 3 and Chart 4.

Table 3 – Locking overhead comparison
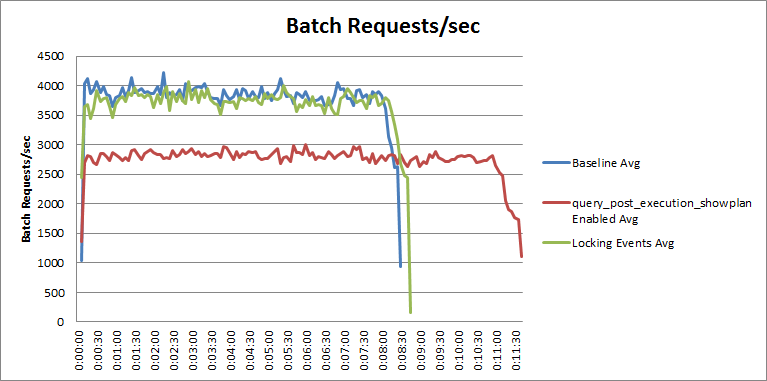
Chart 4 – Locking events overhead comparison
As you can see from the data, the performance effect of these events is significantly lower than for query_post_execution_showplan, even though the locking event session definition was configured to allow all of the events to fire on the server, the total overhead was under 1% overall. Keep in mind that the locking event session evaluated the equivalent of 500 times more events, and in this case all of the events actually had to fire for the event session, where the query_post_execution_showplan event didn’t actually have to fire after being evaluated.
Summary
While the query_post_execution_showplan event provides the ability to collect the actual query plan for a statement that executes, the performance impact of the data collection just to evaluate the event makes it something that is not viable for production usage. At a minimum, the overhead should be considered before you ever use this event against a production workload. Even the event description provided by Microsoft acknowledges that the event can have a significant performance impact (my highlighting):
The event description can be found in the description column of the sys.dm_xe_objects catalog view, or in the New Session UI as shown in Figure 5 (my highlighting):
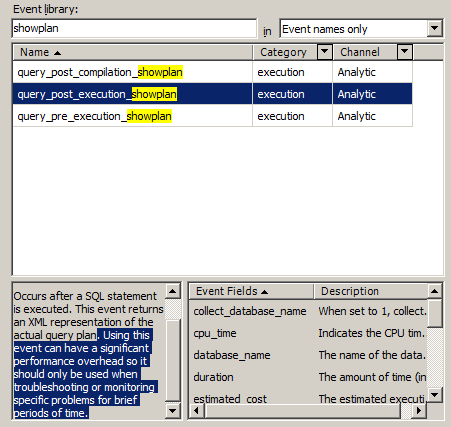
Figure 5 – Event description from the New Session UI
I would recommend benchmarking the performance of any event with this warning in the description before actually using it in a production environment.


Hi
I assume the overhead would be bigger on an OLTP database as compared to a data warehouse batch process?
It would be interesting to capture execution plan for stored procedures running in an ETL batch.
Tahir
The overhead has actually be quite consistent across different types of workloads where I've tested, so I wouldn't recommend using this event in a production server. If you do I'd be wary of the overhead it has to performance, just like you would be with the equivalent event from Trace. There are only a handful of events in XE that the product team explicitly specify in the description that turning them on will impact server performance. So far in testing them, the warning is well intended.